|
|
|
|
DTI
(6 or more diffusion directions)
The tensor field calculation for 6
diffusion encoding gradient directions is based on an analytical solution of
the Stejskal and Tanner s diffusion equation system. For acquired datasets
with more than 6 diffusion encoding gradient directions, a least-square
approach using Singular Value Decomposition (SVD) is used. Datasets hosting
an arbitrary number of diffusion directions can be analyzed, where either the
gradient configuration is read from the DICOM header or from a text-file
provided by the user. Prior to launching the DTI analysis module in nordicICE, it is of
vital importance that the images are recognized as a 4-dimensional
time-series, and that the images are sorted according to image-number. This
will be the case by default if the images were loaded either using the DICOM
reader interface (see “
DICOM Reader ” ) or the DICOM server interface (see “ DICOM database ” ). Once
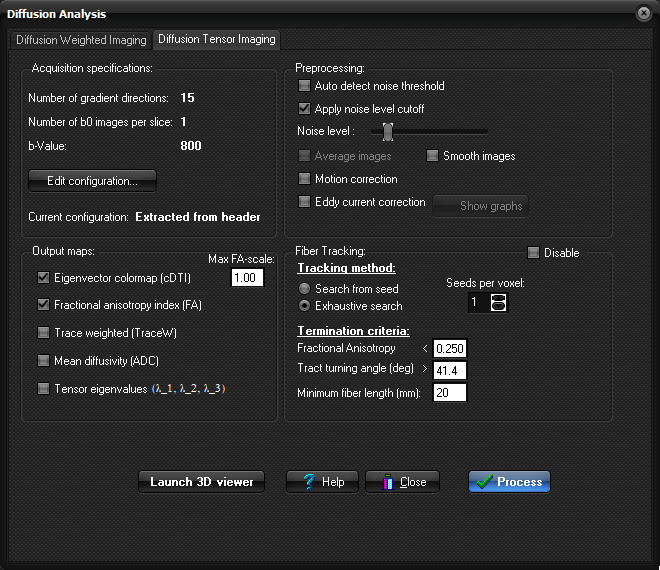
loaded, the Diffusion Tensor Imaging tab can be displayed by selecting
Diffusion Analysis (DTI) on the Modules menu. Note
that you can also run the DTI analysis using the BOLD/DTI
Wizard . Generating DTI
maps
If
nordicICE was able to read the DTI gradient configuration from the DICOM header,
this information will be indicated in the "Number of gradient
directions" and "Number of b0 images per slice" fields. If
these fields states "Not specified", nordicICE was unable to
extract the necessary information from the images itself, and manual
specification becomes necessary. Define
the desired "Preprocessing options",
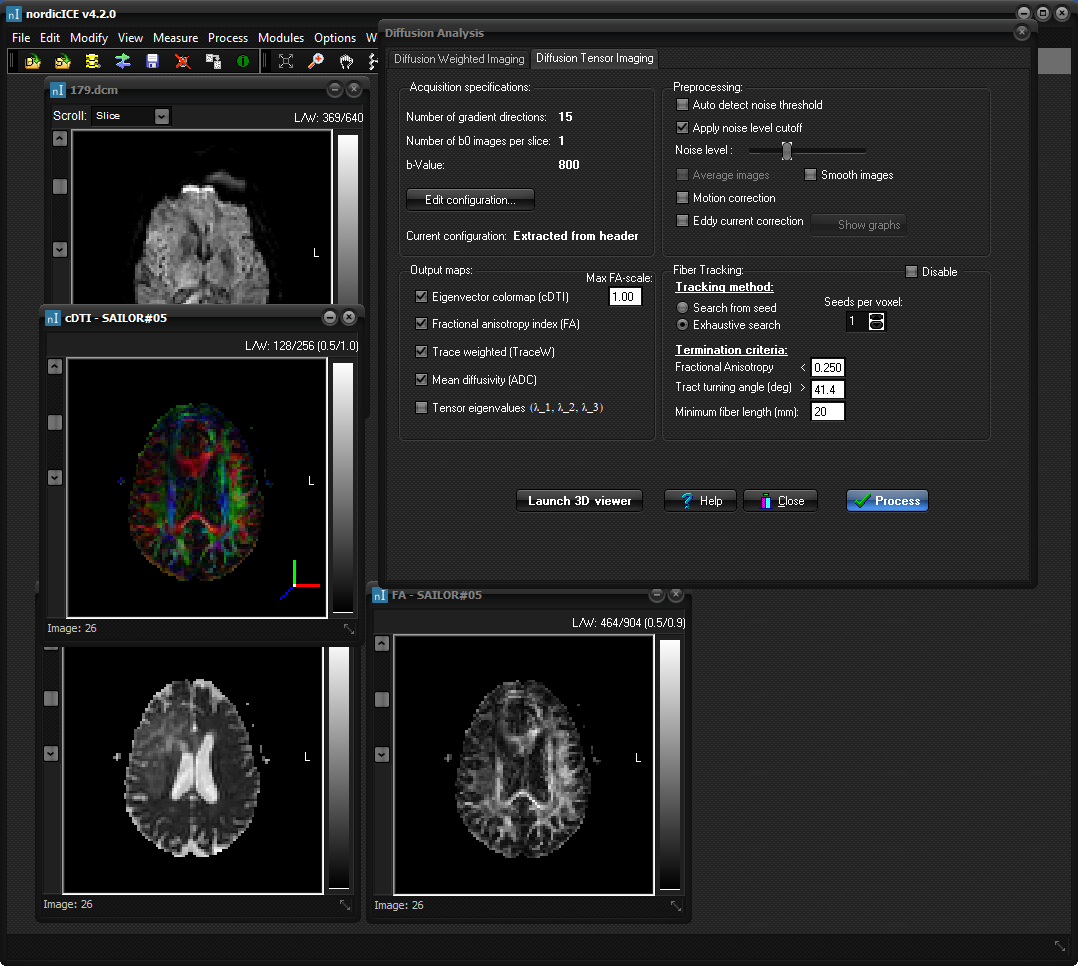
select the requested output images to be generated and click
"Process" button to calculate the parametric maps. These generated
maps will appear as additional image windows in the nordicICE workspace:
Various
measurements can now be performed on the output parametric images using the
Region of Interest analysis feature in nordicICE (see “ Region of
interest (ROI) Analysis ” ). This enables e.g. histogramming of Fractional Anistropy
indices, ADC-values etc. All
generated parametric images can also be saved to any of the file formats
supported by nordicICE (see “
Save Data ” ) or as a new patient series to the DICOM database. You
may also want to use the calculated diffusion tensors to reconstruct white
matter fiber tracts, see “
Fiber Tracking ” . Click the 'Launch 3D viewer' button the open the MPR window for 3D visualization and interaction with
the fiber tracts. |
|