|
|
|
|
Starting
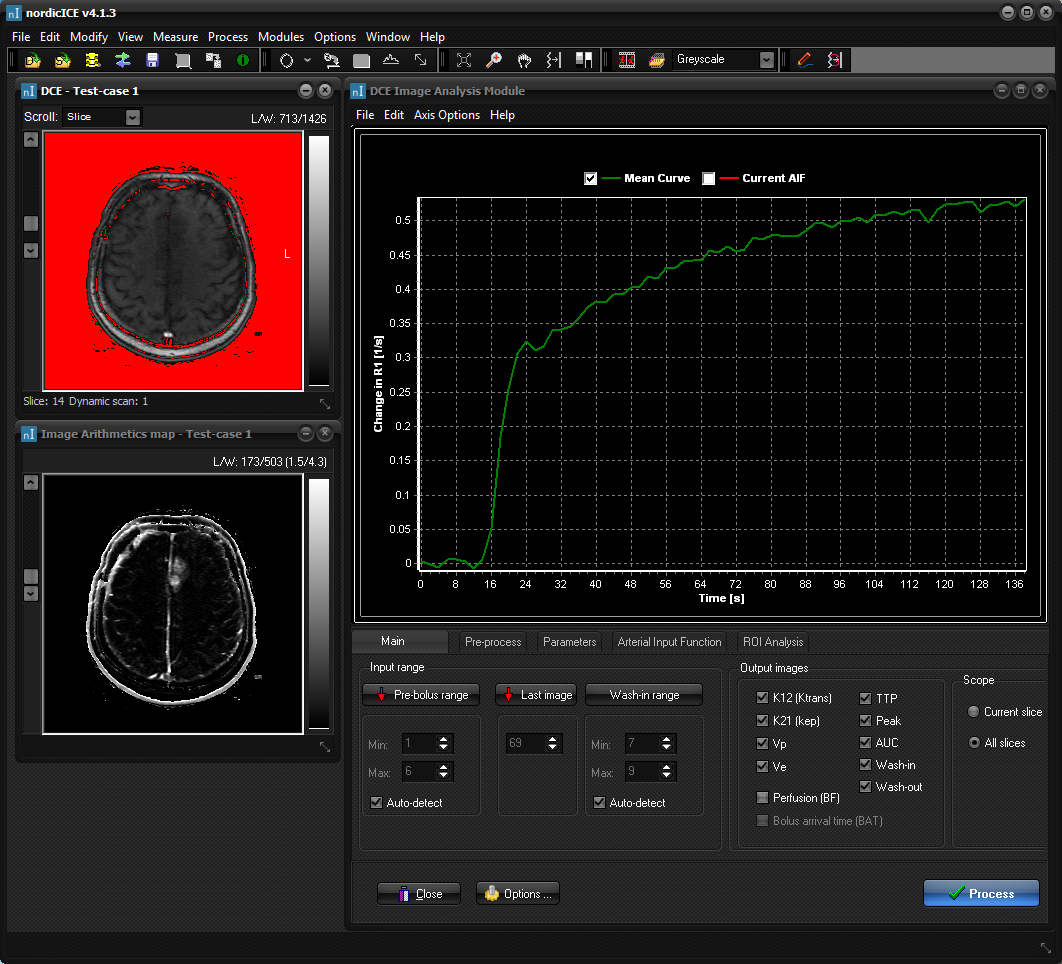
the DCE analysis module
The
DCE module main window will appear together with two image windows - one
containing the original input data and one new window containing the
converted time series for the current slice (called Image Arithmetrics
map). The main DCE window contains multiple tabs (task groups), as
described below as well as a graph showing the dynamic signal response (mean
curve) for the current slice.
Initial
screen layout when starting the DCE analysis module with a T1-weighted
dynamic MR data set (top image window). The default curve shows the global
(average) signal curve for the dynamic series for the current slice
after signal conversion to percent change in signal intensity (SI). If the
baseline level in the input data is different from zero then the time series
needs to be converted to relative signal change or the change in R1. The
signal conversion type is set under the <Parameters> tab. The
second image window contains the dynamic image series for the selected
slice after signal conversion. If the slice is changed in the main image
window (for multi-slice series), the dynamic image window is updated to
reflect the new slice. By default, the noise threshold level is shown as red
overlay in the input dataset. All pixels in red indicate pixels excluded from
further DCE analysis. By default, the noise level is estimated automatically,
but can be adjusted by the user under the <Pre-process>
tab. Note
that ROIs can be drawn in the converted dynamic time series window using any
of the ROI shapes. When a ROI is drawn, the dynamic curve for the selected
ROI will be displayed in stead of the average curve for the entire image. The
DCE Analysis Module menu is sub-divided into four groups (tabs) : The
Arterial Input Function tab is not used if vascular deconvolution
(correction for AIF) is not applied. Related topics:
Loading
dynamic datasets
|
|