MAIN
tab
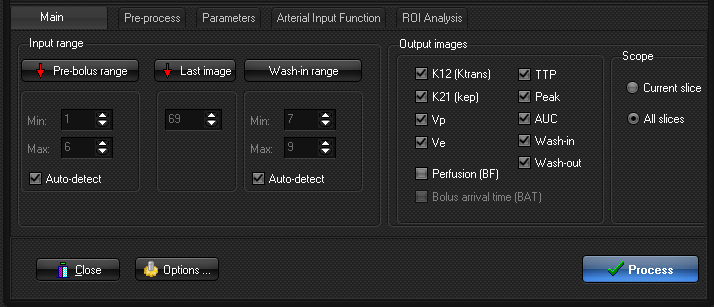
Input range
Under
the Main tab you specify the input image range as well as which output maps
should be generated. Note that you may need to click the <Parameter>
tab to set more options before you generate the desired output maps.
- Pre-bolus range
- Specifies the pre-contrast (baseline) data range;
i.e. the baseline images. This range is used to convert the dynamic
signal to either relative or absolute change in pixel signal (if
selected in the <Signal conversion> field under the
<Parameter> tab). Note that if Signal conversion is set to
<None> it is assumed that the baseline image range has a zero
mean value.
- If <Auto-detect> is checked the pre-bolus
range is determined automatically. Note that for very noisy data,
or dynamic data with very little enhancement, automatic detection of
pre-bolus range may fail.
- For optimal analysis the largest possible number of
baseline images should be included but always exclude initial images if
transient signal intensity (saturation) effects are
present.
- Last image:
- Specifies the last time-point to be included in the
analysis. By default, this is set to the last image in the dynamic
series.
- Wash-in range:
- Specifies the range of images used to estimate the
initial up-slope of contrast enhancement (as well as bolus arrival
time).
- If <Auto-detect> is enabled (default) the up-slope
is estimated automatically. Automatic estimation is done by
detecting the bolus arrival position and then calculate the slope from
this time-point to the time-point of half of maximum enhancement.
- Note that this parameter is only used for analysis
of 'wash-in' or in the estimation of K12 when no AIF
is defined.
Setting
Pre-bolus
(baseline) range and Image range
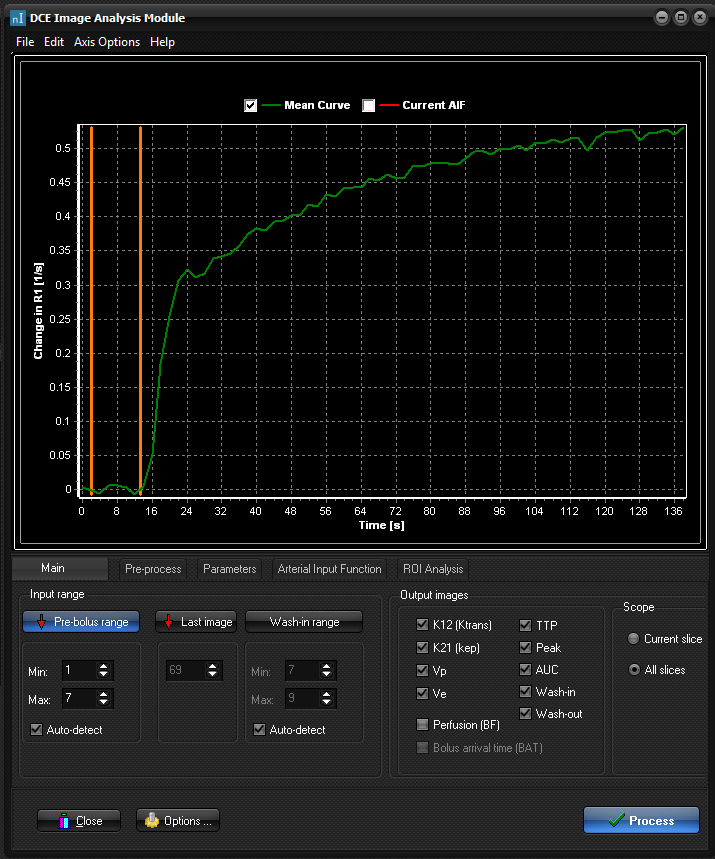
The
baseline, last image values and initial wash-in range can be set graphically
by dragging the blue lines, or numerically by changing the image number in
the Min and Max boxes.
Output images
Here you specify which
output maps should be generated.
- K12 (Ktrans): rate
constant for transfer of CA from plasma to extravascular, extracellular
space (EES).
- K21 (kep):
rate constant for transfer of CA from EES to plasma
- Vp: relative
plasma volume
- Ve: CA
distribution volume (same as EES).
- TTP: time to peak
enhancement.
- Peak: peak enhancement.
- AUC: area under the DCE curve
- Wash-in: initial up-slope of
the DCE curve
- Wash-out: down-slope of the
DCE curve (negative slope from peak enhancement to last datapoint)
- Perfusion (BF)
- Bolus arrival time (BAT)
See Kinetic modeling theory for a description of the
different output maps. The methods used to generate the different perfusion
maps depends on the options set under <Options> as well as under
<Arterial Input Function>. It should be noted that if the arterial
input function (AIF) can not be determined, the the kinetic parameters
K12, K21, Vp and Ve can not be properly determined and the output maps only
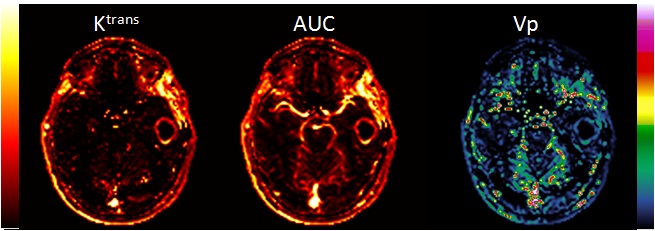
reflects relative values based on the assumption described in the Theory section. Sample output images are shown
below from a patient with primary brain tumor. The images are (left to
right): Ktrans, AUC and Ve ()
Sample output images
Scope:
Specify if selected
output images should be generated for current slice only or for all
input slices.
Once the desired output images have been specified, the maps can be generated
by pressing the <Process> button.
Close
Exit the DCE analysis module. Note that all settings will be
saved when you exit nordicICE so that you don't have to set all the
parameters again if you use the same settings every time.
Options
Here you set advanced
options for the perfusion analysis. See DCE analysis
options for more details.
Tips:
Related topics:
Kinetic
modeling theory

|