|
|
|
|
DTI
interaction panel
The
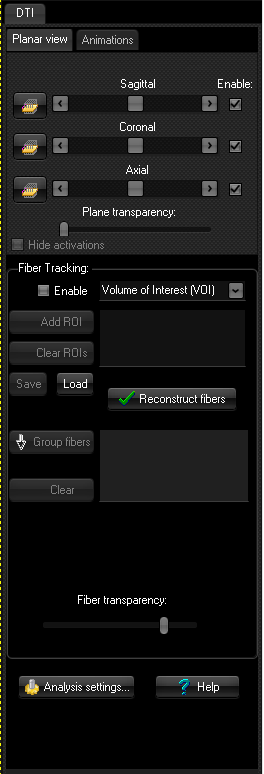
DTI interaction panel provides tools for visualizing and interacting with DTI
3D window in the MPR window . The
upper half of the panel contains the controls for interacting with the
rendered image volume and generating animations. The various features here
are described in the following sections: The lower half of the panel contains
controls related to the visualization and processing of DTI Fiber Tracking. DTI 3D window
The
DTI 3D window is located in the lower right corner of the MPR window and is used to visualize the white
matter fiber tracts reconstructed from the DTI
data. All controls in the DTI interaction panel relates to this window. It
can also visualize BOLD fMRI activations as 'blobs' if enabled from the BOLD interaction panel .
NOTE:
the DTI/Bold 3D window can be maximized to cover all four sub-windows by
double-clicking inside the window. Various
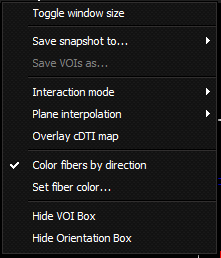
features of the 3D window can be accessed via a popup-menu displayed when clicking
the <menu> button in the top left corner of the window:
Toggle
window size: Toggles the size of the 3D window within
the MPR viewing frame. When toggled, the window size changes between
full-size (hiding the MPR windows) and normal size (both MPR windows and 3D
window). Save
snapshot to... Save a snapshot of the 3D window to either
File (onto local hard-drive) or to the DICOM Database .
Save
VOIs as... Save added VOIs to a file on local
hard-drive. This option is used together with the 'Add ROI' feature
described under the 'Fiber Tracking tab' below. Interaction
mode: Set the interaction mode of the mouse in
the 3D window. Plane
interpolation: Switch on/off nearest neighbour
interpolation of the visualized image planes. Overlay cDTI map: allows you to overlay the colorcoded
DTI map in the 3D viewer. Color
fibers by direction: Toggle the coloring scheme of the
visualized fibers. When enabled, the fibers are colored according to their direction
(Red: Anterios-Posterior, Green: Left-right, Blue:
Inferior-Superior). When disabled, the fibers have one single color as
defined by the 'Set fiber color...' menu entry. Set
fiber color... Set the fiber color to use when the 'Color
fibers by direction' is disabled. Hide
VOI Box: Hide the current VOI box (when enabled). Hide
Orientation Box: Toggle the visibility of the orientation
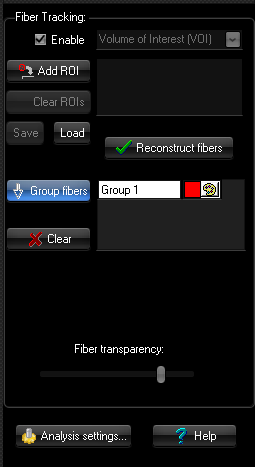
box located at the bottom right corner of the 3D window. Fiber Tracking tab
This tab contains the tools for interacting
with the reconstructed white matter fiber tracts visualized in the DTI 3D
window.
Enable: Enable either Volume of Interest (VOI) or Region of
Interest (ROI) feature in the 3D window. The former will display a
red box in the middle of the visualized volume which can be interactively
positioned and resized by the user, while the latter will enable the user to
draw free-hand ROIs in any of the image planes. Both the VOI and ROI tools
can be used to interactively select reconstructed fibers
passing certain regions of the image volume, and define ROIs/VOIs
constraining the fiber search prior to performing fiber tracking. Add ROI: Add/save the current defined ROI/VOI to the list of defined
ROI/VOIs. This enables the user to store define multiple ROI/VOIs for
selecting fiber connectivity. Each ROI/VOI can be
assigned a logical attribute (AND, OR, NOT) by right-clicking on the
corresponding entry in the list (list-box to the right of the 'Add ROI'
button). Clear ROIs: Clear / remove the ROI/VOIs currently added to the list. Save/Load: Save or Load ROI/VOIs to / from a file. This can be used to
save the ROI/VOIs added to the list. Reconstruct fibers: Perform Fiber Tracking on the current
input dataset. Note that this will clear the current reconstructed fiber dataset (if any) and redo the fiber tracking based on the current defined VOI/ROIs and
settings defined in the 'Settings' tab. Group fibers: Make a group of the fibers passing
through the current defined VOI/ROIs. This allows the user to 'save' the
selected fibers as a group. The user is prompted to
provide a description/name of the group, and when the group is created a
corresponding entry is created in the grouped fiber
list (list-box to the right of the 'Group fibers'
button). The properties of the group (number of fibers,
diffusion statistics) are displayed in the upper left corner of the 3D
window. The fibers in each group can be displayed with
different colors, which can be changed by clicking
on the corresponding entry in the group list. Clear: Clear/delete the current defined groups. Fiber transparency Set the transparency (opacity) of the visualized fibers.
|
|