|
|
|
|
BOLD
interaction panel
The
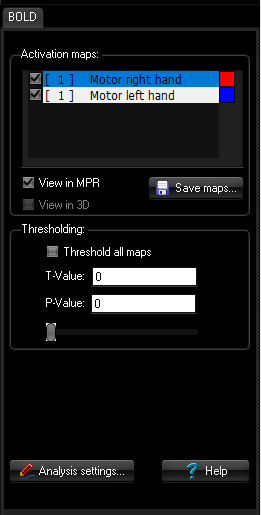
BOLD interaction panel provides tools for visualizing and interacting with analyzed BOLD data in the MPR
window . Activation maps
This
field contains a list of all the current available activation maps resulting
from the BOLD analysis. By default, all available activation maps are
displayed as overlay on the current visualized image volume in the MPR view.
By clicking on a checkboxes to the left of each entry in this list you can
toggle the visibility the respective overlay, and by clicking on the color-field to the right you can change to color. View in MPR: Toggle on/off the visualization of activation maps as
overlay in the MPR view View in 3D: Toggle on/off the visualization of activation maps as 'blobs' in
the DTI 3D window . Save maps...: Saves the activation maps as DICOM series to the DICOM database.
Thresholding
This
field contains the controls for applying thresholds to the displayed
overlays. The overlays can be thresholded either
individually or they could be given the same threshold value. Threshold all maps: Check this if you would like all overlays to have the same
t-value threshold. Do not check mark if you would like
to threshold each overlay
individually. If disabled, the overlay corresponding to the
current selected activation in the Activation
maps list box will be thresholded. T-Value: Choose the minimum T-Value to display in the overlay. The
corresponding P-Value will be estimated and updated
automatically. P-Value: Choose the P-value of the statistical output map. The
corresponding T-Value will be estimated and updated automatically. T-Value Slider: The T-Value slider allows you to interactively update the
overlays while dragging the slider. The corresponding P- and T-Value
will be updated automatically.
|
|