|
|
|
|
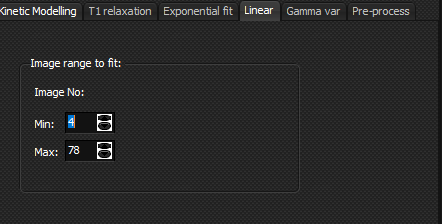
Linear
tab
To
display the Linear tab, select Data modelling ... from the Processing
menu of the ROI intensity curves dialog.
Fits the ROI data to a
linear function of the form y=ax + b Image range to fit: specifies the range of input images to include
in the linear fit procedure. The values can also be set interactively by
moving the vertical lines in the ROI intensity window. Related topics:
T1
Relaxation tab
|
|