|
|
|
|
Image
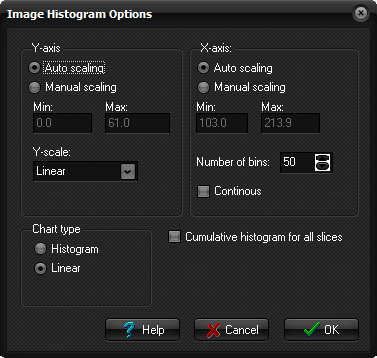
Histogram Options
The
Image Histogram Options dialog box is displayed when you select Options
... on the Image Histogram dialog box.
Y-axis Auto/Manual scaling: Select automatic scaling or manual scaling by specifying Min
and Max values. Min: / Max: Specify minimum and maximum values when Manual scaling is
selected. Y-scale: The Y-axis scale can be set as follows: Linear: The data is displayed without modification Logarithmic: The logarithm (log10) of the input data is displayed. Relative frequency: Each histogram bin is scaled according to the number of entries
in this bin relative to all entries. (i.e. the sum of all bins equals 1) X-axis Auto/Manual scaling: Select automatic scaling or manual scaling by specifying Min
and Max values. Min: / Max: Specify minimum and maximum values when Manual scaling is
selected. Number of bins: Number of bins (groups) the ROI data should be divided into. Continuous: Display the data as continuous bars with one line per pixel
intensity in the ROI. Chart type Histogram: Display the data as distinct histograms with the number of bins
specified. Linear: Display the data as a continuous line with the Y-value given by
the number of ROI pixels at a given pixel intensity. Cumulative histogram
for all slices When this option is checked, a single histogram is made for all active
(i.e. visible) ROI's in all slices. When enabled, image scrolling has no
effect on the displayed histogram since the histogram is the cumulative sum
of all ROI's. Related topics:
Image
Histogram
|
|