|
|
|
|
ROI
histogram
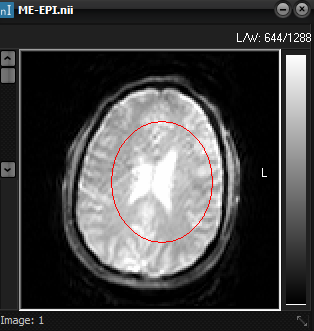
nordicICE can display ROI data as ROI histograms; i.e. sorting the data in each ROI into
multiple groups (bins) and plotting the number of pixels in the ROI belonging
to a given bin.
By
default, the data is sorted into 10 bins (i.e. 10
groups from the lowest to the highest pixel value in the ROI). The number of
bins can be dynamically changed to any number as described in “ ROI Histogram options ”. As for the ROI Intensity curve, the current
ROI can be frozen using the Hold Curve function. This will keep the
current histogram for the ROI unaltered, and subsequent changes in the ROI
will generate a new histogram next to the old one. The histogram can be
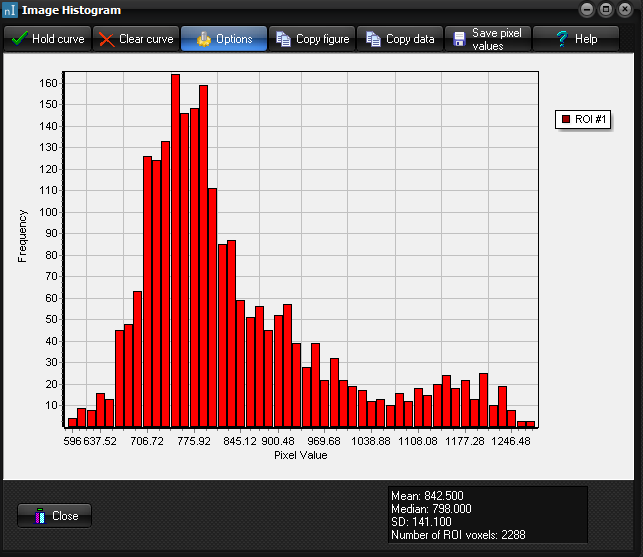
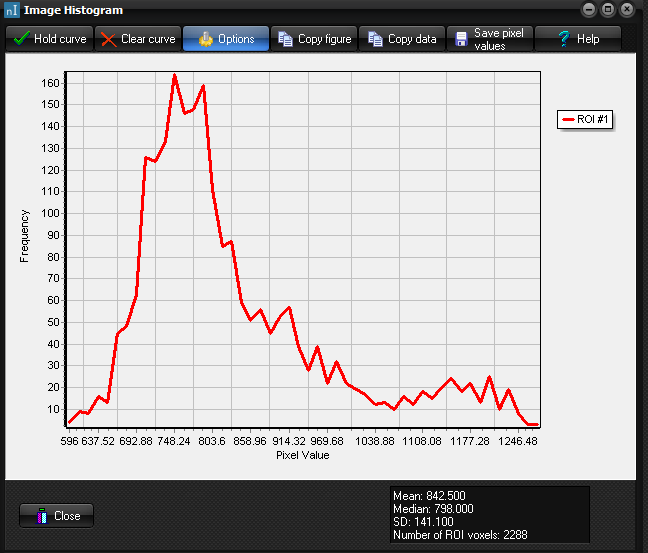
displayed either as a bar chart of a line chart (see below). The histogram
data can also be saved to the clipboard:
This
command copies the histogram data as a ‘;’ delimited text file with two
columns and number of rows equal to the number of bins set in the Number of bins
option. The first column contains the mean pixel intensity for the bin and
the second column contains the number of pixels in the bin.
This
copies the entire ROI Histogram figure to the clipboard. The ROI Histogram window
showing the histogram for a single ROI as a
bar chart (left) or line chart (right)
Tips:
Related topics:
|
|