|
|
|
|
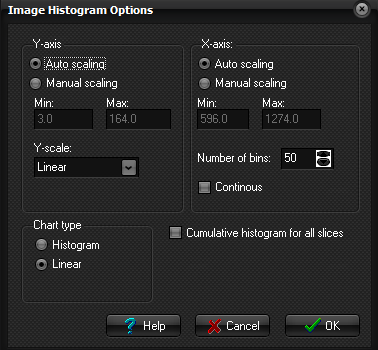
ROI
histogram options
The ROI Histogram options dialog.
The
settings related to scaling of the X- and Y-axes are like the scaling options
for ROI intensity curves as described in “ Axis options. ”. Additional options are: : Number of bins (groups) the ROI data should be divided into : Can be either linear, logarithmic or frequency (relative number
of items per bin) : Display the data as continuous bars with one line per pixel
intensity in the ROI : Display the data as distinct histograms with the number of bins
specified : Display the data as a continuous line with the Y-value given by
the number of ROI pixels at a given pixel intensity. : When this option is checked, a single histogram is made for all
active (i.e. visible) ROIs in all slices. When enabled, image scrolling has
no effect on the displayed histogram since the histogram is the cumulative
sum of all ROIs. Related topics:
|
|