|
|
|
|
Image
Histogram
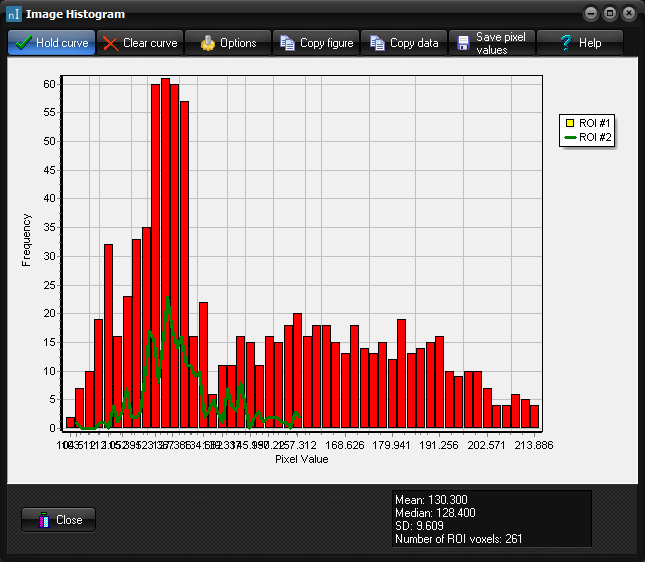
The Image Histogram dialog
box is displayed when you select ROI -> View
-> ROI Histogram from the Measure menu. Or <Ctrl>+h.
A region of interest (ROI) must be set in the active
dataset for this option to be enabled.
Hold curve: Freeze the current ROI. This will leave the current histogram
for the ROI unaltered, and subsequent changes in the ROI will generate a new
histogram next to the old one. Clear curve: Clear the ROI histogram last froze by Hold curve. Options: Open the histogram options dialog. Copy figure: Copy the entire ROI Histogram figure to the Windows Clipboard. Copy data: Copy the histogram data to the Windows Clipboard. This will copy
the data as a ; delimited text file with two
columns and number of rows equal to the number of bins set in the Number of bins
option. The first column contains the mean pixel intensity for the bin and
the second column contains the number of pixels in the bin. Tips:
Related topics:
Region
of interest (ROI) Analysis
|
|