|
|
|
|
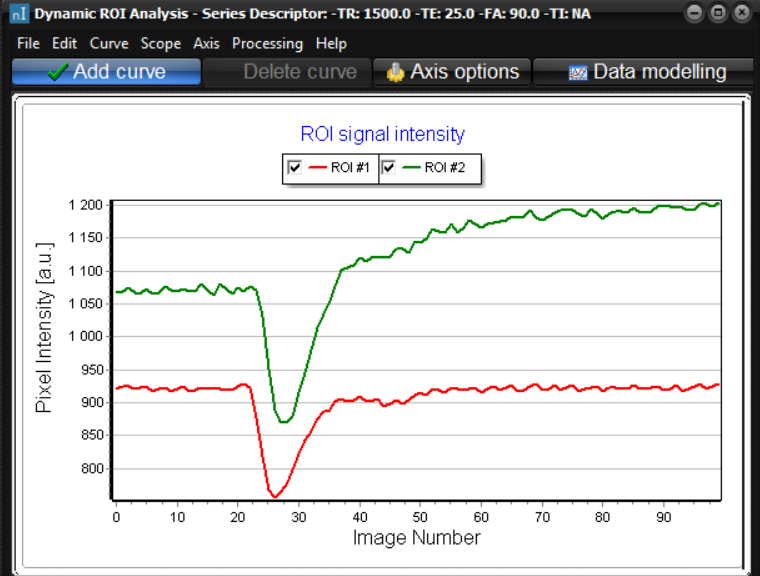
ROI
intensity curves
This
function enables drawing of dynamic changes along multiple image volumes for
one or multiple ROI's.
nordicICE can display intensity curves for one or
multiple ROI s. This menu option can be activated when the ROI option is activated,
and a ROI is displayed on the image (see “ Region of interest (ROI) Analysis”).
A
ROI intensity curve is a curve that reflects the change in ROI value across
the images in the loaded image series. This is relevant to e.g. assess ROI
changes in a dynamic time series or as a function of another relevant
parameter (e.g. echo time in a multiecho series). Note that such ROI
intensity curves can also be obtained for four dimensional datasets. In this
case the ROI intensity curve is always obtained along the time-axis (or echo
time axis) if the image series is multislice. Various curve fitting routines
can also be applied to the ROI curve (see below) and one or multiple ROI
curves can be copied to/from the Windows clipboard or saved as a text file. The
current ROI curve is updated dynamically upon changing the current ROI in the
image. If multiple ROI curves are displayed (see below) any curve can be made
active by clicking on the curve of interest. The active curve is displayed
with square gray point labels. You
can add a new curve by selecting Add curve from the Curve menu.
This will freeze the ROI for the current curve and keep it displayed while
you change the ROI. A new ROI curve will be displayed showing the values for
the changed ROI. You
can remove the active curve by selecting Delete curve from the Curve
menu. You
can apply a curve fitting algorithm to the active curve. Select Data
modelling ... from the Processing menu to do this. If no
curve is active, the curve fit will be applied to the last created curve. You
can perform transforms on the active curve by selecting Transforms
from the Processing menu. The following transformations are
available:
The
scaling of the axis is normally determined automatically to make the whole
curve fit within the window. If you want to change the scaling or select
which parts of the curve are visible, you can select the Options from
the Axis menu. You
can modify the ROIs used for one or more of the datapoints on a curve. Select
ROI update from the Scope menu, and then select which set
of ROIs you want to update. You can load or save
ROI intensity data by using the File menu. Related topics:
Draw
and Measure Pixel Values in a Region of Interest (ROI)
|
|