|
|
|
|
Draw
and measure pixel values in a region of interest (ROI)
This
option is used to obtain the pixel values from one or multiple ROIs. To draw
and measure a ROI:
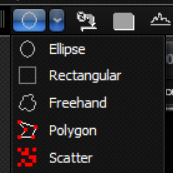
The
toolbar icon shows the currently selected ROI type. This can be altered by
clicking the small arrow to the right of the icon. The ROI shape is selected
from the appearing drop down menu on the toolbar associated with the ROI
icon. Click to select the required shape.
The Rectangular and Ellipse shapes
are set. Click and hold down the left mouse key within the shape to move it
(a hand pointer appears), or on the perimeter to draw out the ellipse or
square (a double headed arrow appears).
The Freehand tool allows a ROI to be
accurately drawn around observed structures. Press the left mouse key and
trace the shape. On release of the mouse key a straight line is drawn to the
point of initiation.
To draw a Polygon , point and click
on the desired locations. To close the polygon, press Alt and click. A
straight line is drawn to the point of initiation.
The Scatter option allows measurement
of single points. Clicking on subsequent locations is additive and the ROI
value measured is the mean of the different scatter points. This option is
useful for example to sample the mean pixel value in an irregular structure
such as an artery. When
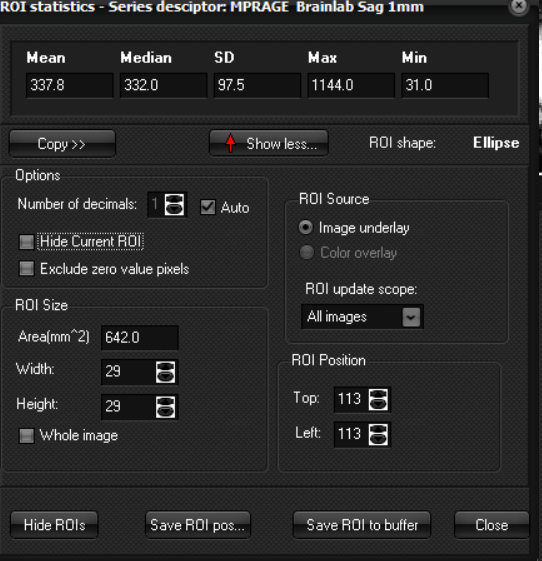
the Draw ROI function is activated, the ROI statistics window
opens. The series descriptor appears at the top of the window and if ROI
analyses are to be performed on multiple image series, it is recommended to
add series descriptors for each series to differentiate between the ROI
statistics and ROI buffer windows for the different images or image series
under examination. The
ROI
statistics window displays all relevant information about
the current ROI. The first time (in a session) the ROI function is activated,
the ROI statistics window will automatically appear and stay visible as long
as the ROI function is activated. If the ROI statistics window is closed
during a ROI drawing session, it can be re-opened by selecting
The
following options are available from the ROI statistics window: ROI Size / ROI
Position : For rectangular and elliptical ROI s, the ROI size is displayed
in the window. For other ROI types, this information is grayed out. Note that
the ROI size and position can also be changed using the scroll bars to he
right of each parameter. ROI Source : Determines whether the ROI operation should be applied to the
image overlay (see later section) or the underlay (default). The image
underlay is here equivalent to the loaded image set if no overlay is present.
Hide Current ROI : Temporarily hides the current ROI (see Advanced ROI functionality ) Exclude zero value pixels : Exclude pixels with a value of zero from the statistical ROI
analysis. Since some functions in nordicICE will set pixel
values to zero in response to certain critieria, this is a means of excluding
such pixels from the ROI analysis. ROI statistics : Displays the mean, standard deviation, max, min and median
pixel values in the current ROI as well as the ROI area and volume. Note
that, by default, the drawn ROI is applied to all the images in the volume
and the volume of interest (VOI) is therefore, by default, calculated as ROI
x slice thickness x No. of slices. The ROI shape, size and position can,
however, be individually adjusted for each slice. See Advanced ROI
functionality for more details. ROI Update Scope : Determines which images a given change in the current ROI is
applied to. This is convenient if a given ROI should be applied to a subset
of the images (e.g. current image to last image or current image to first
image or just current image). See Advanced ROI functionality for
more details. : Removes multiple ROI s according to the setting of the ROI update
scope parameter. See Advanced ROI functionality for
more details. : Adds the active ROI to the ROI Buffer, as described in Saving ROI data
to the Buffer . Save ROI pos: Saves the ROI object as a .roi file. This
option allows a given ROI to be loaded back with the same properties (shape,
size, position) as when it was saved. Copy: Copy the ROI statistics to the clipboard Related topics:
Saving
and loading ROIs
|
|