|
|
|
|
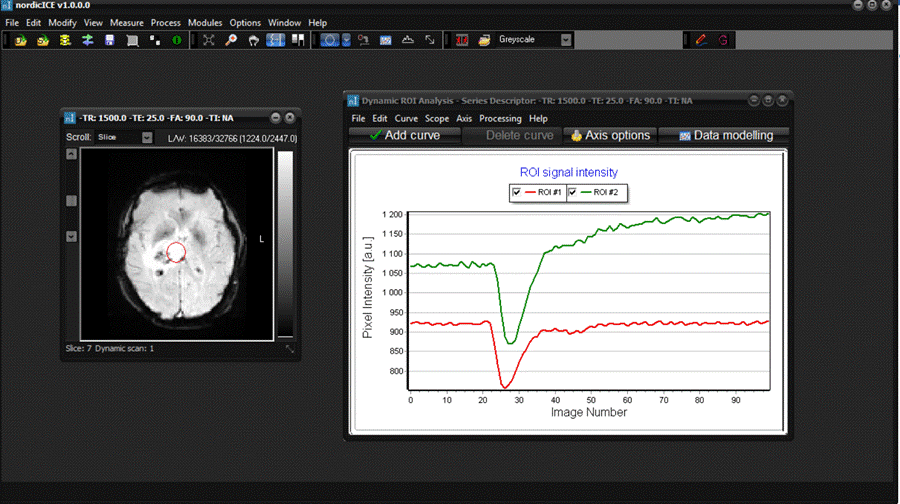
ROI
intensity curves for multi-dimensional datasets
If
multi-dimensional datasets are loaded (e.g. dynamic
multi-slice or multi-echo multi-slice) then the ROI Intensity curve will
always be drawn along the fourth dimension (i.e. not across slices but along
time-axis or echo time axis). The exception to this is when the image
scroll-box is set to All,
in which case the ROI intensity curve is drawn for all loaded images (usually
not a feasible option). The example below shows the ROI intensity curve for a
multi-slice dynamic dataset. With the Image Scroll-box set to Slice,
the ROI intensity curve will be drawn across all dynamic time-points for the
current ROI position in the current slice. If the image volume is scrolled to
another slice, the ROI intensity curve will be updated to reflect the current
ROI position in the new slice. If the scroll box is set to Dyn. scan,
then the ROI Intensity curve will show the same thing;
i.e. the ROI variation along the dynamic scan axis. Scrolling through the
images now will not change the ROI intensity curve since each new image
represents a different point on the current ROI intensity curve. ROI
intensity curve for multi-dimensional dataset
For
multi-dimensional datasets the ROI intensity curve will always be drawn along
the time-varying (or echo-varying) dimension and not along the slice
dimension. In the example shown, the image scroll-box is set to Slice
and the resulting ROI intensity curve shows the ROI variation along the
image time dimension for the current ROI position. Modifying the ROI or
scrolling to another slice will update the ROI Intensity curve for the new
ROI location. Setting the image scroll-box to Dyn. scan
will similarly produce a ROI Intensity curve along the dynamic scan axis for
the current slice. Related topics:
ROI
intensity curves
|
|