|
|
The
Arterial Input Function tab - Applying vascular deconvolution
In
nordicICE, you can do perfusion analysis with or without defining the
arterial input function. To
generate semi-quantitative perfusion maps, the arterial input function (AIF)
must be defined. Note that, although the AIF is defined and corrected for,
the resulting maps can still not be considered to represent true perfusion
(in MRI). This is primarily because the relationship the measured signal
change and the underlying contrast agent concentration is not known. Still,
if proper definition - and correction for AIF is performed, a perfusion
index may be obtained which should be independent of the AIF in each patient
or given examination allowing for comparison of perfusion data obtained in
different patients or at different time-points in the same patient. nordicICE
performs deconvolution of the tissue response curves (dynamic curves for all pixels)
with the AIF using the mathematical method called singular value
deconvolution (SVD), as first proposed for this purpose by Ostergaard et al
(Magn Reson Med. 1996 Nov;36(5):715-25) and further refined by e.g. Wu et al
(Magn Reson Med. 2003 50:164–174). The
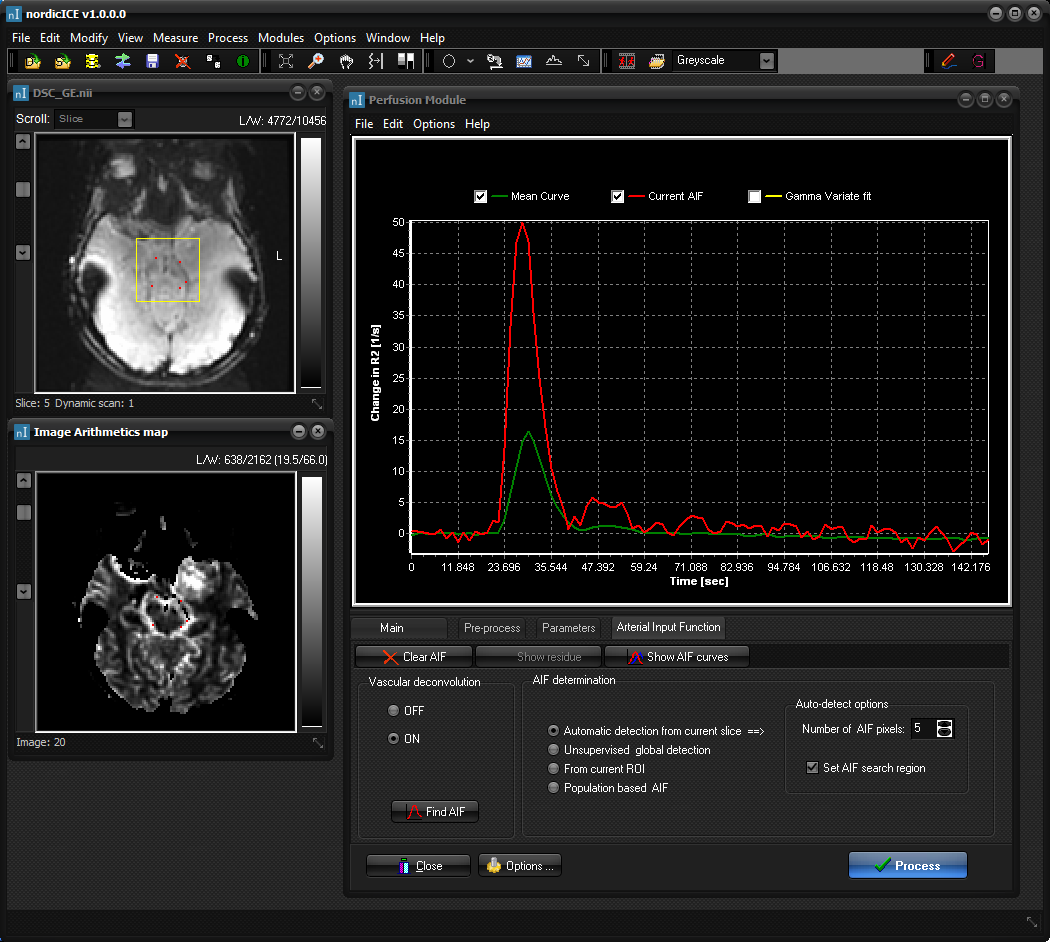
AIF is set under the <Arterial Input Function> tab:
Turn
on Vascular deconvolution to show AIF options. AIF
determination can be done using one of the following methods: Automatic detection from current slice: The
AIF is automatically detected by analysing the properties of all pixel time
curves in the current slice and applying cluster analysis to select the time
courses which most resemble the excepted AIF properties (large area under
curve (AUC), low first moment and high peak enhancement). The automatic AIF
detection is based on the method first described by Mouridsen et al (Magn
Reson Med 55(3); 2006). The
number of AIF pixels to be selected from the search procedure can be
specified. A region of interest (Set AIF search region) can be defined to
limit the search for AIF to this region only. Select 'Find AIF' to start the
search. After the search, the chosen pixels are show in red on the images.
The average AIF is shown on the main graph (indicated in red on the figure
above). Each of the AIF curves can be visualized selecting 'Show AIF curves'.
Unsupervised global detection: This
method will search for AIF pixels in the entire volume (all slices) using a
clustering analysis. See Advanced Options for more
details. From current ROI: Determine the AIF manually
from region of interests (ROI) selection. The AIF pixels would then typically
be selected using a scatter ROI. Once the AIF pixels have been selected,
press the Set AIF button to define the AIF. See Region of Interest Analysis for more details on ROI
selection. Population based AIF: This will use a
pre-defined population based AIF. You can choose between three different
types of population-based AIFs. See Advanced Options
for more details. Clear AIF:
Clears the selected
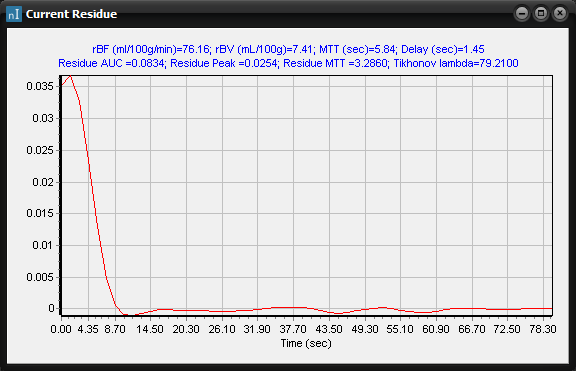
AIF and resets all AIF related parameters. Show residue:
Displays
the residue function in a separate window. Note that a ROI must be active in
the SI converted dynamic image series for this option to be active. The
displayed residue function is the result of deconvolving the current ROI time
intensity curve with the selected AIF. The curve will interactively update
when moving the ROI.
This
option is only enabled when a region of interest is drawn in the dynamic time
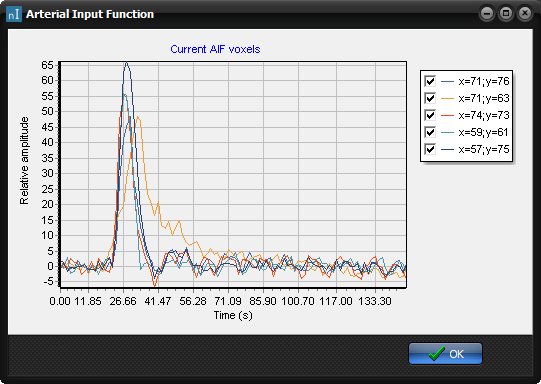
window and an AIF is defined (pressing the Update AIF button). Show AIF curves:
Displays the individual
dynamic time curves for each pixel in the selected AIF (for
auto-detected AIFs).
|
|