|
|
|
|
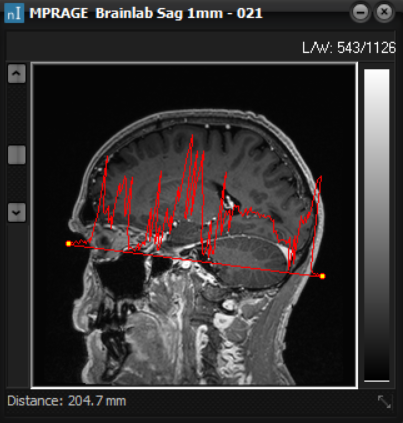
Line
Profile
This
option draws a signal intensity profile along a user defined line on the
image. The relative amplitude along the line reflects the pixel intensity in
the image. Press the left mouse key at the desired start-position and drag to
the desired end-position. On releasing the mouse button
the intensity profile is displayed along the selected line. The start- and
end-position of the line can be moved by dragging the yellow bullet points.
The line can be copied between image series in the same way as a ROI using
the menu items under Measure->Line Profile or by using the shortcuts
Ctrl-Alt-K (copy) and Ctrl-Alt-V (paste). Clicking the line profile button
again disables the option and deletes the line profile. Line
profiles may be saved as ASCII text files. The individual pixel values along
the drawn line are listed with semi-colon delimiters facilitating import into
Excel for analysis (->->).
The ascii file cannot be re-imported into nordicICE. Note: The
scaling of the values listed in the text file is dependent on the setting on
the Various sheet in Options->General Options. Choosing Processed data
means that the actual values on the screen are used, choosing Raw data means
that the underlying data of the image series is used. The line profile
graphics is visible on the image after copy & paste operations between nordicICE
and other Windows programs.
Related topics:
Copy
images and color bars
|
|