|
|
|
|
VAI
spesific perfusion maps
The
VAI perfusion related maps are generated according to previously published
definitions and notations (Emblem et al. Nat Med. 2013; 19:1178-83; Stadlbauer et al. J
Cereb Blood Flow Metab. 2017; 37:632-43; Xu et al. Magn
Reson Med. 2013; 69:981-91). See Theoretical background
- Vessel Architectural Imaging for additional information. In
short, the pixel-wise GRE and SE dynamic signals are converted to change in
R2 and R2*, respectively for the SE and GRE signals. The resulting deltaR2
values are then raised to the power of 3/2 and a gamma variate (or Gaussian)
function is the fitted to the resulting time curves. The fitted curves are
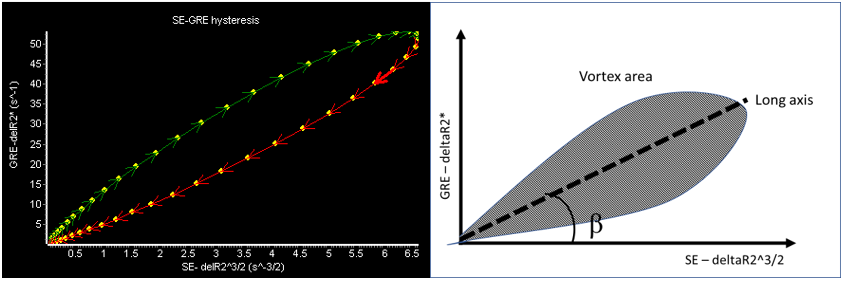
then plotted with delR2^3/2 along the x-axis and delR2* along the y-axis,
forming the characteristic hysteresis loops. The hysteresis loops are
characterized by the loop
direction, long axis, slope of long axis and the area of the loop,
properties shown to be related to microvascular properties. In the VAI
module, the voxel-wise loop direction is visualized by the arrows making up
the loop as well as the arrow color (figure 1).
Figure 1: Characteristic hysteresis loop generated by plotting
Gamma fitted SE vs GRE signals. Note that the direction of the loop is
indicated by the color and direction of the arrows. The
following metrics are estimated: . VAI vascular fraction (Vf). Vf is defined as the long axis of the
hysteresis loop (figure 1). A.
Vortex area (VA). This is defined as the shaded region in figure 1 b. The cortex
area can optionally be scaled by Vf so that VA(scaled)
=VA/Vf. VA can also optionally be colored according to loop direction so that
loops with clockwise loop directions have warm colors and negative loop
directions have cold colors (figure 2). B.
Vortex direction. Binary image where a value of 1 equals
clockwise loop direction and a value of -1 equals CCW direction. C.
Peak shift: The shift in the peak (fitted) SE vs GRE signals. Positive
shifts for SE leading GRE signal. D.
Vessel calibre. Defined by the slope of the long axis (figure 1 b) E.
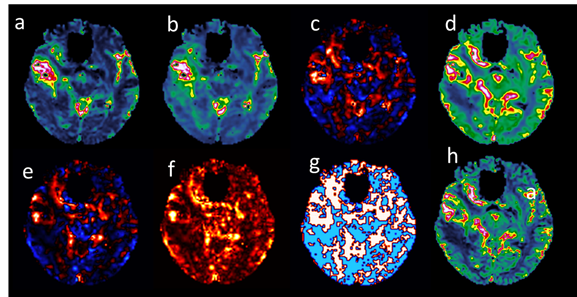
Vessel size image (VSI): Defined by Examples
of different VAI-related perfusion maps are shown below.
Figure 2: Sample VAI related perfusion maps: Vessel size index
(a), Vessel calibre (b), peak shift (c), Vascular fraction (d), Vortex area
(direction sensitive) (e), Vortex area (f), vortex direction (g) and for reference,
normalized CBV (h). See
References.
|
|