|
|
|
|
Seed-based
fMRI resting state analysis
The Resting state fMRI analysis module can be used to generate
and visualize correlation maps from acquired resting state fMRI time series.
The analysis is a seed-based analysis, used to investigate how the time
series in one region in the brain correlates to other regions. The correlation coefficient is calculated as Pearson correlation
coefficient:
where
the x_i are
the signal intensities of the time curve for the pixel under investigation,
and the y_i
are the signal intensities of the time curve of the seed region. This latter time
curve is calculated as the mean of the time curves of the pixels in the seed
region. The module is started by selecting Resting State fMRI analysis
from the Modules toolbar, with the resting state DICOM data loaded and
selected. Starting
the module will create a copy of the original data, and automatically start
any preprocessing that is selected (motion correction, Gaussian smoothing and
bandpass filtering). Preprocessing steps can be changed and redone (see Preprocessing in resting state fMRI). After
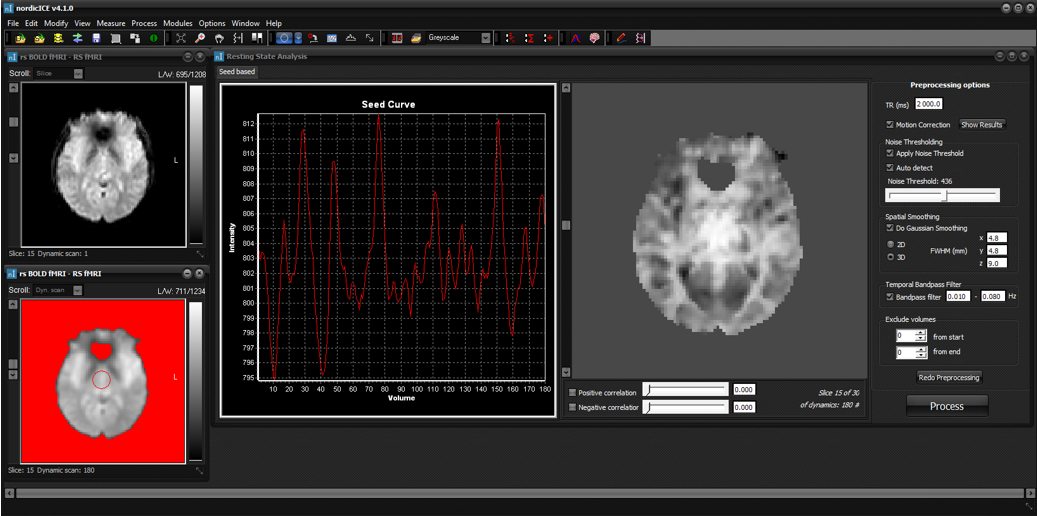
preprocessing is done, the seed-curve and corresponding correlation map from
a seed ROI position in the middle of the middle slice (lower left image) will
be displayed in the main window (right).
You
can move the ROI by dragging it around the image, and the time curve and
correlation map will update interactively. You can change the displayed slice
for the seed ROI using the scroll bar on the upper left image. You can also
change the slice of the correlation map using the slider on the left-hand
side of the map. You
can change the displayed map in the main window to display positive and/or
negative correlations, with a given threshold using the slider below. Note that
the negative correlation is given as a positive value.
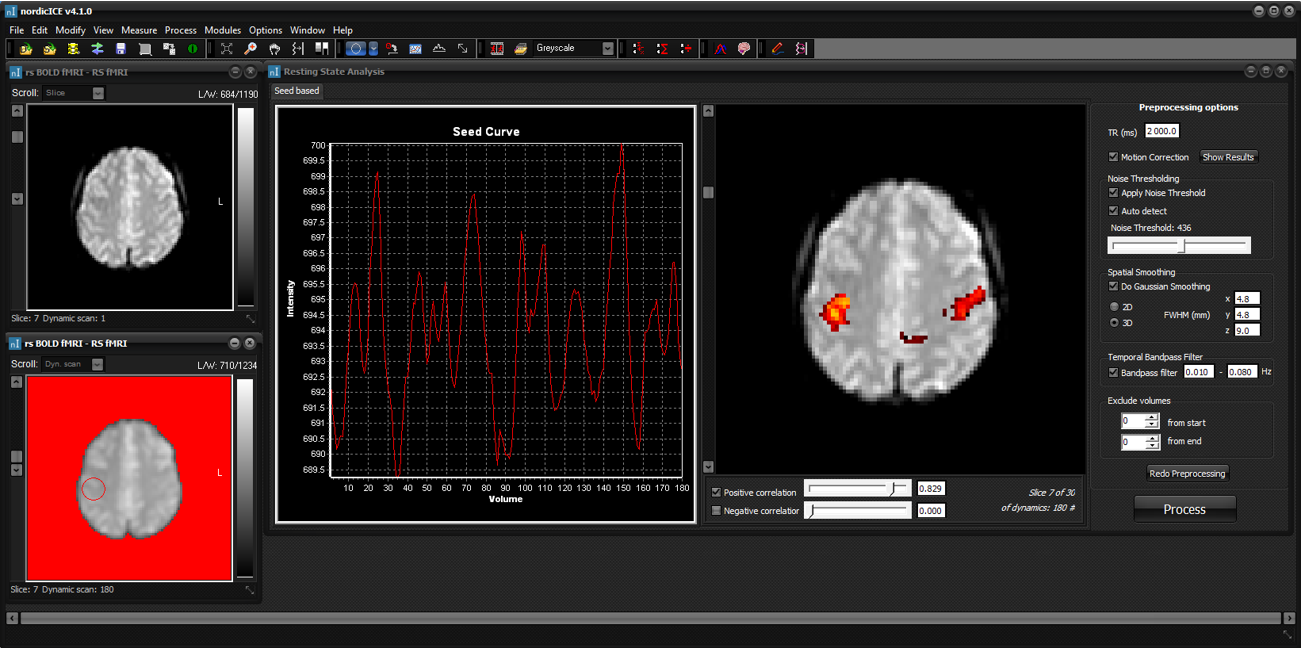
In
the example above, the positive correlation map is thresholded at a
relatively high value of 0.829. In this case, the same slice is selected for
the seed ROI and the positive correlation map, and displays where in the
brain a correlation above the selected threshold can be seen. There is a high
degree of correlation with the seed itself, as expected, but also with the
area in the opposite hemisphere. Note that this is included as an example
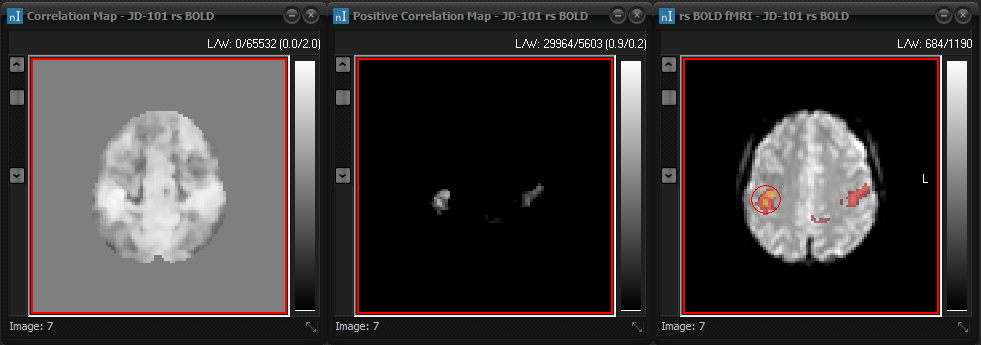
only. Selecting
Process will generate the output maps: If
positive, negative or both correlations are selected, the following maps will
be generated:
If
positive and/or negative correlation are not selected, the output map will be
the correlation map only. Further
reading: Preprocessing in resting state fMRI Tips
Link images together
for simultaneous scrolling through slices using shift + left click. See
Options -> General Options -> Image Linking. |
|


