|
|
|
|
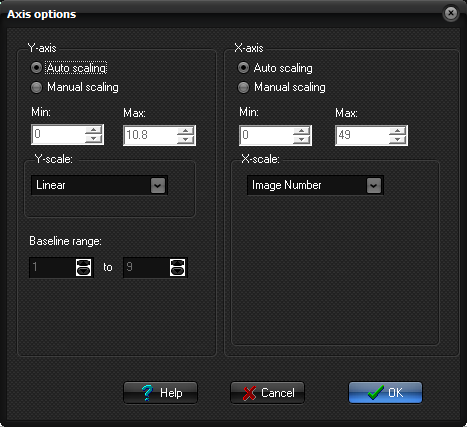
The
axis options dialog
Y-axis
Auto/Manual scaling: Select
automatic scaling or manual scaling by specifying Min and Max
values. Min: / Max: Specify
minimum and maximum values when Manual scaling is selected. Y-scale: The
Y-axis scale can be set as follows: Linear: The
data is displayed without modification Logarithmic: The
logarithm (log10) of the input data is displayed. Relative (percentage change): The
data are scaled according to 100*(SI-SIo)/SI0,
where SIo is calculated as the mean of the
datapoints defined by the two range lines. Delta R2: (MRI only). The
data are converted according to ln(SI/SIo)/TE (in 1/sec) where SIo is
defined as above and TE is the echo time (in ms).
The TE value is obtained from the Dicom header.
This scaling option is used to convert SI values to changes in the T2
relaxation rates. If the Delta R2 scaling is used, then a baseline range must
be set defining the image range (ROI datapoints) which define the baseline
signal intensity; i.e. the SI before contrast agent
arrival in the ROI. X-axis
Auto/Manual scaling: Select
automatic scaling or manual scaling by specifying Min and Max
values. Min: / Max: Specify
minimum and maximum values when Manual scaling is selected. X-scale: The
X-axis scale can be modified to reflect the appropriate range for a given
situation. For instance, if the curve represents datapoints in a multi-echo
sequence, the X-axis scale can be set according to the TE for each datapoint.
The X-axis values can be either manually set or, for DICOM images, automalically extracted from the DICOM header. Image number: Scaled
from 0-N-1 where N is the number of datapoints. Image time (dynamic): Scaled
according to the relative dynamic image time of each data-point. The
following X-values data sources can be chosen: Echo time (TE): Scaled
according to echo time for multi-echo data series typically used to calculate
T2 relaxation times. Inversion time (TI): Scaled
according to the inversion time for inversion recovery MR data series.
Typically used to calculate the T1 relaxation times. b-value (DWI): X-values represent diffusion b-values used in diffusion
weighted imaging (DWI). Typically used to estimate diffusion metrics like
apparent diffusion coefficient (ADC). Flip
Angle (FA): X-values represent flip angles (MRI). Typically used to
estimate T1-relaxation properties from multi FA
data. If the X-axis scale is set to
anything other than image number, additional options become visible: Use Dicom values: Enabled
for image time and echo time X-values. If this option is checked, the
X-values are attempted to be read from the DICOM header. If no appropriate
information can be found in the header, an error message will be issued. Constant time/TE/TI/b-value/FA
spacing: Enter
the appropriate X-value for the first datapoint and the spacing between
datapoints according to the selected X-axis scale. Edit: Edit
the X-values. Here, you can modify the specified X-values or set values
manually e.g. with non-constant spacing between
datapoints. You can also paste data from the clipboard or load from file (one
value per line in text format). Update: Update
the values entered in constant X-values spacing Note: The Axis options
dialog can be displayed by selecting Axis options ... from the Options
menu in the Perfusions Module dialog. Related topics:
Perfusion
Module
|
|