Visualizing
parametric maps as overlays
Visualizing
parametric maps as overlay is achieved by simply drag & dropping the
desired parametric map into one of the MPR windows. The overlay appearance
can then be modified via the menu options under the <Overlay> tab.
Here you can change the overlay transparency, toggle visualization of overlay
on/off and change window/level as well as color palette used.
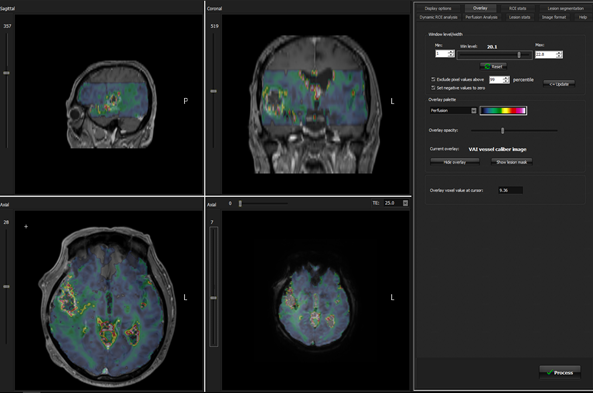
Figure 1: Visualization of functional output map (VAI vessel
calibre map) as overlay and corresponding overlay settings menu.
Sometimes,
the generated parametric maps may contain outlier values which could result
in a ‘flat’ map due to some extreme values. This effect can be reduced by
checking ‘remove outliers’ under the <Perfusion Analysis> tab prior to
perfusion analysis. Further, the color palette can be improved by excluding
extreme values in the resulting overlay map. By default, the 1% highest pixel
values are eliminated when pressing the ‘update’ button under the
<Overlay> tab, if selected.

|