Overview
of menu options and shortcuts
Region of interest (ROI) functions
Three
different ROI methods are available.
Freehand : draws a freehand trace ROI in
active window
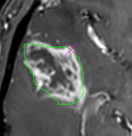
The
trace is auto-completed (to form a closed shape) upon releasing the mouse
button. The final ROI can be Moved (pressing right mouse button with cursor
on pink cross).
Polygon (spline) ROI
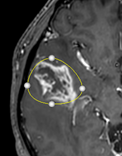
The
polygon ROI is initially displayed as a circle with four ‘anchor’
points that can be moved to change the shape of the ROI. Additional anchor
points can be added by <ctrl>+ right button click. The whole ROI can be
moved by left-clicking anywhere on the ROI line.
Rectangular ROI:
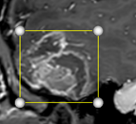
Displays
a rectangle that can be moved by right-clicking anywhere inside the ROI. The
size/shape can be changed by clicking any of the four edge circles.
The
ROI stats window
displays the statistics for the currently selected ROI:
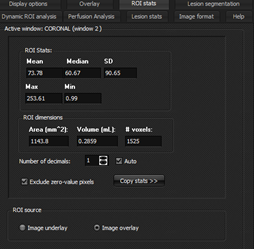
The
statistical data can be copied to the clipboard (Copy stats >>) and the
ROI source can be switched between the underlay and overlay data (of
present).
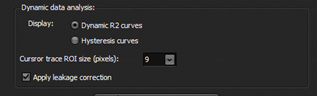
Display of time-intensity-curve for active ROI: if the
data in the current ROI window is dynamic, the time intensity curve (TIC) for
the selected ROI will be shown in the ROI Intensity curve under the ‘Dynamic
ROI analysis’ tab.
Switching between <trace> and <pan> modes
<Trace> mode  enabled interactive tracing of
current cursor position in all three orthogonal MPR views, and also display
of TIC for current cursor position (or multiple voxels around the cursor) in
case of dynamic data as specified by the ‘Cursor trace ROI size’
options (below) enabled interactive tracing of
current cursor position in all three orthogonal MPR views, and also display
of TIC for current cursor position (or multiple voxels around the cursor) in
case of dynamic data as specified by the ‘Cursor trace ROI size’
options (below)
Right
click in trace mode: change window level/width
Pressing ‘z’ + right click: zoom image
<Pan/zoom mode >  is
used to interactively zoom/pan images and disable MPR tracing: is
used to interactively zoom/pan images and disable MPR tracing:
Right-click: Zoom active image
<shift> + left-click: pan active image
Pressing ‘w’ + moving cursor in active window (not pressing button)
: changing image window / level
Additional
shortcuts and tips
- Toggle overlay on/off (if present) : <ctl + O> or ‘Hide/show’
overlay button under ‘Overlay’ tab
- Toggle lesion mask on/off (if present): <ctl + M> or ‘show lesion mask’
check box under ‘Dynamic ROI analysis’ tab and ‘Lesion
stats’ tab.
- Toggle volume of interest (VOI) on/off: <ctr + V> or press any of the <set target
VOI> buttons

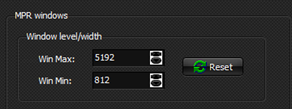
Settings window/level numerically from menu:
Done
under <Display options> and set separately for MPR images and
functional images. <Reset> button will reset win/level to values at
load-time (which are inherited from the settings in nordicICE upon starting
the VAI module). Window level/width can also be set using the mouse.
Interpolation:
chose between cubic spline and nearest neighbour interpolation for the
display.
Defining VOI and tumor mask :
These
two menu options should typically be used together: first, define the volume
of interest  and then segment the tumor by activating
the seed growing function and then segment the tumor by activating
the seed growing function  . .

|