Displaying
data as volume/MIP render
Structural
data can be displayed in separate volume render window by pressing the <Launch volume render window> button
under the <Display
options> tab. Note, this option can also be launched for
dynamic data, whereby the currently selected dynamic scan will be selected
for volumetric view.
By
default, when the volume render option is launched, data will be displayed in
‘plane render’ view; that is simultaneous display of the three orthogonal
planes (like the display in the nordicICE DTI module):
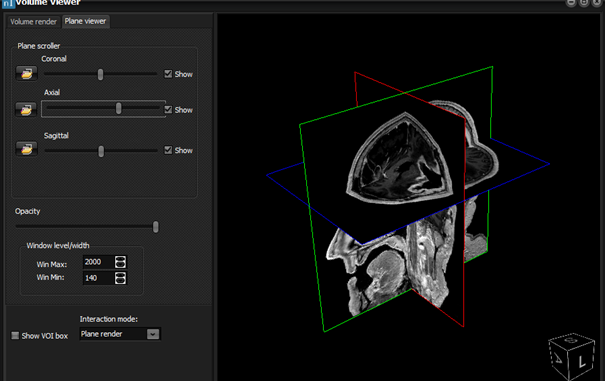
Figure 1: Default ‘plane render’ view when launching volume
render option.
Two
additional viewing modes can be selected from the <interaction mode>
pulldown menu:
Volume render mode
(figure 2) and maximum intensity projection (MIP) mode.
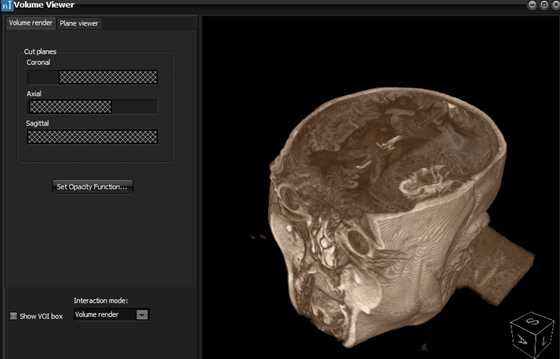
Figure 2: Volume render mode.
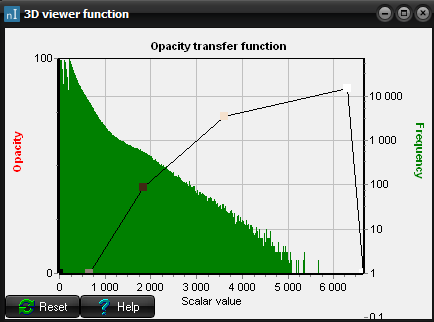
Note
that for volume render and MIP mode, optimal visualization can be tuned using
the <set opacity
function> option
If
a lesion segmentation has been defined for the current structural dataset,
then the segmented volume will be displayed as a separately rendered
structure in volume render mode (figure 3).
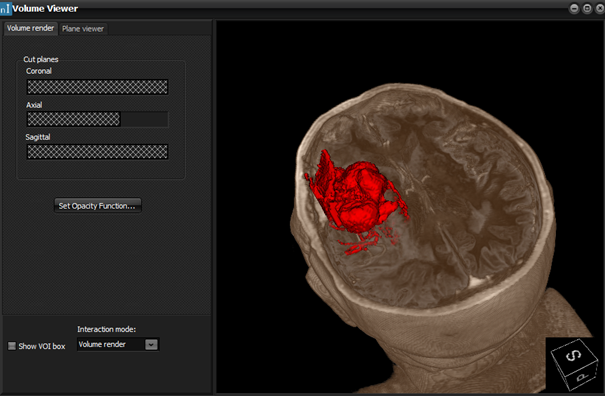
Figure 3: Visualization of segmented tumor volume in volume
render window.

|