Perfusion Module - Advanced Options
Note: This section has not been updated to reflect changes in nordicICE version 4.0. Section will be updated soon. Some parts of the section might still be relevant.
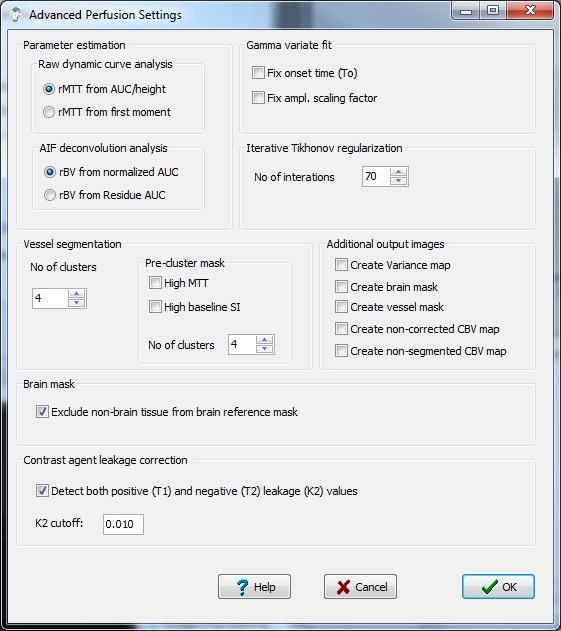
Here you specify advanced options related to the perfusion analysis.
These options need not be modified for most types of perfusion analysis.

Parameter estimation:
Raw dynamic curve analysis:
When no AIF deconvolution is applied, both CBV ann CBF are only
determined in a relative sense based on the properties of the
first-pass tissue response curve. From this curve, the perfusion
parameters can be estimated in different ways. The relative CBV is
always estimated from the area under the first-pass curve (AUC), but
relative perfusion and mean transit time can be estimated in two
different ways.
- MTT from AUC/peak: The
most common approximation is to use the 'height-area' relationship to
estimate MTT: With this approach, the relative blood flow is simply
estimated as the peak height of the fiirst - pass curve (Cpeak).
Relative MTT is then determined as rMTT = AUC/Cpeak.
- MTT from first moment: With
this approach, MTT is estimated from the normalized first moment of the
first-pass curve: rMTT = fmAUC/AUC and rBF=AUC/rMTT. Where fmAUC is
the first moment of the area under the first-pass curve.
AIF deconvolution analysis:
When AIF (arterial input function) deconvolution is applied the
cerebral blood volume can be
estimated in two different ways as specified below:
- rBV from normalized AUC: The
blood volume is estimated by the normalized area under the dynamic
curve; that is the area under the tissue response curve divided by the
area under the AIF. This is the most common method for estimating the
BV when the AIF is known. .
- rBV from Residue AUC: Selecting
this method, the BV is estimated from the area under the residue
function curve where the residue function is estimated by AIF
deconvolution. This method of determining BV may be theoretically more
correct but is also more sensitive to noise and to the choice of
deconvolution method(see Perfusion
settings).
Gamma variate fit:
Gamma variate fitting is inherently an unstable problem due to the
exponential / non-linear and multi-parametric nature of the gamma
variate function. In order to reduce the parameter space, some
parameters can be fixed which may improve the stability of the fitting
if raw data is noisy.
- Fix onset time (To): The
bolus arrival time is fixed according the the upper limit of the
pre-bolus range set by the user. By default, the onset time is
determined iteratively as part of the curve fitting procedure.
- Fix ampl. scaling factor: The
amplitude scaling factor of the gamma function is fixed to one. By
default the amplitude scaling factor is determined iteratively as part
of the curve fitting procedure.
Iterative Tikhonov regularizartion:
Here you specify the number of iterations to run when the optimal
singular value filter factor is determined iteratively for Tikhonov
regularization. The iterative procedure searches for the
'optimal' trade-off between a 'correct'
solution and an oscillating solution. For
details of the method, see Hansen HC (SIAM Journal
on
Scientific Computing 1993;14(6): 1487 – 1503).
- No of iterations: This
is the total number of iterations used to determine the optimal
regularization value. Note that if a large number of iterations are
used, the deconvolution analysis is significantly slower than when a
fixed threshold in used.
Vessel segmentation:
Vessel segmentation is a method to remove vessels from the perfusion
maps. Vessel segmentation is based on cluster analysis of each pixels
in the image where the cluster classes are set according to the
temporal dynamics of the first-pass curves (for details of the method
used, see Emblem et al. Magn Reson Med 2009
May;61(5):1210-7) . Using this approach,
arteries and veins are identified based on their unique temporal
characteristics. Vessel segmentation is challenging in cases of
elevated perfusion, i.e. in a malignant tumor since it is hard to
differentiate the temporal characteristics of highly perfused tissue
relative to that of an artery. To aid in this differentiation, a
pre-cluster mask can be defined which eliminate pixels either with high
MTT or with high baseline signal intensity. Both these criterias can in
some instances help differentiate between vascuclar tumor tissue and
vessels. It should, however be noted that the vessel segmentation
option should be used with caution, and there is no guarantee that the
segmented pixels are a correct representation of vessels.
Pre-cluster mask
This option can be used to exclude pixels from the vessel
segmentation procedure based on certain characteristics thought to be
specific for tumor tissue. This is meant to be an aid in avoiding tumor
tissue to incorrectly be masked out as vessels.
- High MTT: Exlude high
MTT
pixels from vessel segmentation. This option will only have an
effect if the highly vascularized tissue has elevated MTT values
compared to vessels.
- High baseline So: Exclude
tissue with high relative basline signal intensity.
This option will only have effect if the signal intnsity of the hightly
vascularized tissue has high SI relative to vessels. This is typically
the case if the baseline images are T2/T2* weighted.
Number of clusters: specifies
the number of cluster classes used to determine the pre-cluster mask
high and the number of clusters used in the main vessel segmentation
analysis.
Additional output images:
Specification of additional output images which can be generated:
- Create variance map:
Create image(s) where the pixel values represents the
variance in the time intensity curve
- Create brain mask: Create
binary image(s) where all pixels which are are determined to
represent brain pixels (excluding
'abnormal' time curves and vessels, if vessel removal is selected - see
below) are set to one and all other pixels are set to zero. This
image is the same as the one used as reference template in the leakage
correction procedure (see below) and also the same image used to
normalize perfusion values, if selected (see Perfusion
settings).
- Create vessel mask: Creates
a binary image where each pixel is set to 1 or 0 depending on whether
it is classified as vessel or not.(see Perfusion
settings for details on vessel segmentation)
- Create non-corrected
CBV maps: Creates an
additional CBV map which is not contrast agent leakage corrected (All
other perfusion
maps are leakage corrected when leakage correction is selected). This
option is only active if leakage correction is enabled, see Perfusion
settings for details.
- Create non-segmented CBV map.
Creates an additional CBV map where the vessels have not been
removed. This option is only active if vessel segmentation is enabled..
Brain Mask
Some processing steps require a brain mask to be generated:
perfusion normalization and contrast agent leakage correction (see
below). The mean value of the brain mask is used for normalization
whereas the dynamic first-pass response of the brain mask is used to
correct for leakage. In both cases, the brain mask is generated from
the first-pass characteristics of each pixel in each slice. Initially,
all pixels which are above the set noise level are determined to
represent brain. Then all 'leaky' pixels are excluded (base on negative
tail). A more comprehensive search for brain pixels can optionally be
performed:
- Exclude non-brain tissue : When
selected, non-brain tissue like vessels and 'abnormal' tissue are
removed from the brain mask. 'Abnormal' tissue is recognized based on
baseline tissue intensity and peak first-pass intensity values.
Non-brain tissue is exluded using k-means cluster analysis of the
first-pass tissue response.
Contrast agent leakage correction:
The underlying kinetic model used in the perfusion module assumes that
the contrast agent is contained in the intravascular space for the
duration of the dynamic acquisition. If the blood brain barrier is
severely compromised due to pathology this assumption may no longer be
valid. When <Apply apply contrast
agent leakage correction>
is checked in the main menu contrast agent leakage from the
intravascular to extracellular space is corrected for using the method
published by
Weiskoff et al (1994). In short, this method
assusmes that the
contrast agent exhibits T2 or T2* effects ('negative contrast effect')
in the intravascular compartement but that the contrast effect is
mainly T1-shortening once the agent leaks into the extracellular space
(due to reduced compartementalization). Therefore, in regions of
contrast agent leakage the dynamic curve will go below zero after R2
conversion since the SI is increasing above the baseline level due to
T1-enhancement. This artefactrual undershoot in the dynamic curve will
leak to an under-estimatino of blood volume (and flow) in regions of
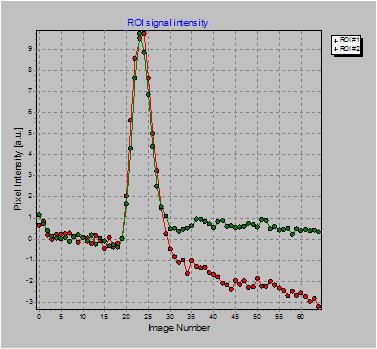
lekage (see figures below). The figure below shows sample curves of a
region wihout (green) and with (red) significant contrast agent
leakage. When leakage correction is enabled an additional output image
can be generated ('Leakage map'). This is a 'pseudo Ktrans' where
the pixel intensity is proportional to the rate of contrast leakage
from the intra- to the extravascuclar space.
- K2 cutoff: Leakage
values (in terms of the leakage constant K2) with an absolute value
below the specified limit will be set to zero.
- Detect both positive (T1) and
negative (T2) K2 values: When
set, the leakage correction includes leakage causing both T1 and T2
effects and hence does not depend on the 'tail' of the dynamic curve
being negative in leaky pixels.

Example of ROI with
contrast agent leakage (red curve) compared to ROI with no leakage

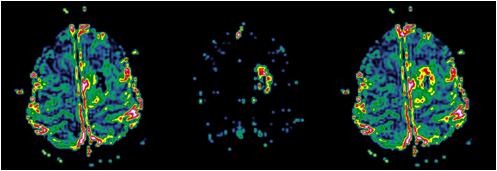
Uncorrected rBV map (left); corresponding leakage map (centre) and
corrected rBV map (right).
Note the higher rBV values in the corrected image in the tumour rim
corresponding to areas of high K2 value (large leakage).